Estimation application downloads and cost
Description
GFXBench 3.1 is a free, cross-platform and cross-API 3D graphics benchmark that measures graphics performance, long-term performance stability, render quality and power consumption with a single, easy-to-use application.
GFXBench 3.1 adds new special tests to the popular GFXBench 3D graphics benchmark.
New features:
Enhanced low-level tests: ALU2, Texturing, Driver Overhead 2 – replacing the original low-level tests of GFXBench 3.0, these ES 3.0 tests better approximate the workload of the Manhattan test
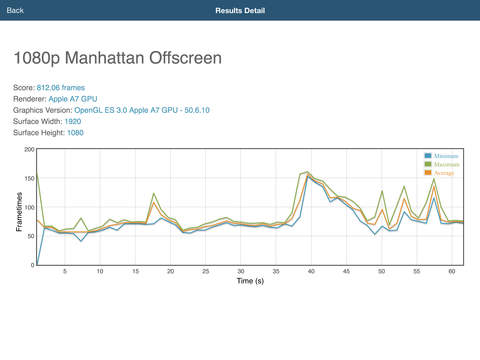
Detail graphs: all test results are now augmented with frame time graphs to provide additional information. Just press the score on the results tab to view.
Features from GFXBench 3.0:
Battery and Stability test: Measures the device’s battery life and performance stability by logging frames-per-second (FPS) and expected battery running while running sustained game-like animations (the T-Rex scene).
Render quality test: Measures the visual fidelity provided by the device in the high-end gaming-like scene
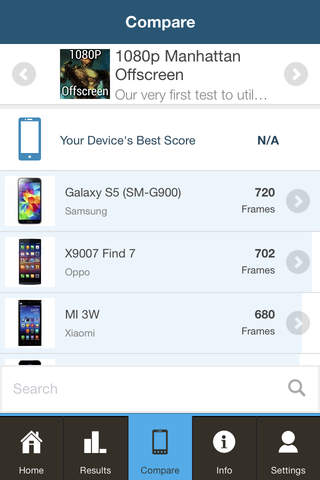
Multi-lingual, easy-to-use user interface: device comparison within the application by downloading the complete GFXBench database, extensive system information.
Please note: The benchmark needs at least 300 MB free space on the device.
You can compare your benchmark results with all the other uploaded results at our website: www.gfxbench.com.
If you need any help, please contact us via email at [email protected]!
Read more
GFXBench 3.1 adds new special tests to the popular GFXBench 3D graphics benchmark.
New features:
Enhanced low-level tests: ALU2, Texturing, Driver Overhead 2 – replacing the original low-level tests of GFXBench 3.0, these ES 3.0 tests better approximate the workload of the Manhattan test
Detail graphs: all test results are now augmented with frame time graphs to provide additional information. Just press the score on the results tab to view.
Features from GFXBench 3.0:
Battery and Stability test: Measures the device’s battery life and performance stability by logging frames-per-second (FPS) and expected battery running while running sustained game-like animations (the T-Rex scene).
Render quality test: Measures the visual fidelity provided by the device in the high-end gaming-like scene
Multi-lingual, easy-to-use user interface: device comparison within the application by downloading the complete GFXBench database, extensive system information.
Please note: The benchmark needs at least 300 MB free space on the device.
You can compare your benchmark results with all the other uploaded results at our website: www.gfxbench.com.
If you need any help, please contact us via email at [email protected]!


